TensorFlow For Tears: Part 1
How do you deal with the travails of colic and new parenthood? You plunge yourself into an ML project, of course. Here, we discuss a naive solution to detecting baby cries via an onboard microphone on a Raspberry Pi.
An introduction to every parent’s trial and travails
When our son was born early last year, I admit I wasn’t ready for it. Fatherhood was not the kind of thing I was ready for (and who really can ever be ready for parenthood, anyways?).
It so turns out that the vast majority of the first year of parenting is simply enduring the gut-wrenching cries of your little one. And cry they do - crying when they are too tired, screaming when they are too energetic, crying when they are gassy, screaming when they are bored, and crying when they just pooped.
The trials that Annie and I went through with our little guy was particularly difficult on us (you can ask me in person if we ever get to chat). The little guy was a prolific screamer and absolutely. hated. sleep.
What’s a geeky dad to do? Quantify household suffering by leveraging machine learning, of course.
I set out to build a system that would in the end determine how well our little guy slept through (or didn’t sleep through) the night. I started by building a system that naively parsed audio samples from his nursery, and then trained a TensorFlow model to do more accurate detection of his cries. Here’s how it worked:
Act 1: The Misery Meter
In version 1 of the system, I bought a cheap USB microphone and hooked it up to a Raspberry Pi 3.
In it, I loaded up a script to record a 30-second audio sample, using the arecord UNIX command line tool:
1
2
3
4
5
6
7
8
9
#!/usr/bin/env bash

set -euxo pipefail

DIR="$( cd "$( dirname "${BASH_SOURCE[0]}" )" && pwd )"
RECORDING_FILE="${DIR}/recordings/sample.wav"
DATE=$(date "+%Y-%m-%d %H:%M:%S")
UPLOAD_RECORDING_FILENAME=$(printf %q "${DATE}.wav")
arecord --device=hw:1,0 --format S16_LE --rate 48000 -c1 -d 30 --quiet "${RECORDING_FILE}"
…then I ran the sox command-line tool to grab some simple loudness statistics out from it:
1
sox -V3 ${RECORDING_FILE} -n stats 2>&1 | grep dB
In case you’re curious, here’s the full output from sox -V3 FILE -n stats. Pretty nifty:
1
2
3
4
5
6
7
8
9
10
11
12
13
14
15
16
17
18
19
20
21
➜ sox -V3 sample.wav -n stats
# ... Truncated for brevity ...

sox INFO sox: effects chain: input        48000Hz  1 channels
sox INFO sox: effects chain: stats        48000Hz  1 channels
sox INFO sox: effects chain: output       48000Hz  1 channels
DC offset   0.000017
Min level  -0.141083
Max level   0.135651
Pk lev dB     -17.01
RMS lev dB    -29.32
RMS Pk dB     -27.37
RMS Tr dB     -30.83
Crest factor    4.12
Flat factor     0.00
Pk count           2
Bit-depth      14/16
Num samples     480k
Length s      10.000
Scale max   1.000000
Window s       0.050
Here, we’re really only interested in RMS dB, which is the relative loudness levels within this 30-second sample. I chose to push these three stats up to a web service which I use to aggregate and graph these metrics. RMS lev is the average, RMS Pk is the peak, and RMS Tr is the trough (the floor).
I’m not showing the entirety of the script, but the last thing it does is parse and push the results of the analysis of this audio sample to a Web-based metrics aggregation service! In case you were wondering, I have an API service sitting between the Raspberry Pi and a time-series API supplied by Keen.io. But the main point is that now I can load up a cute JS widget that graphs these data points!
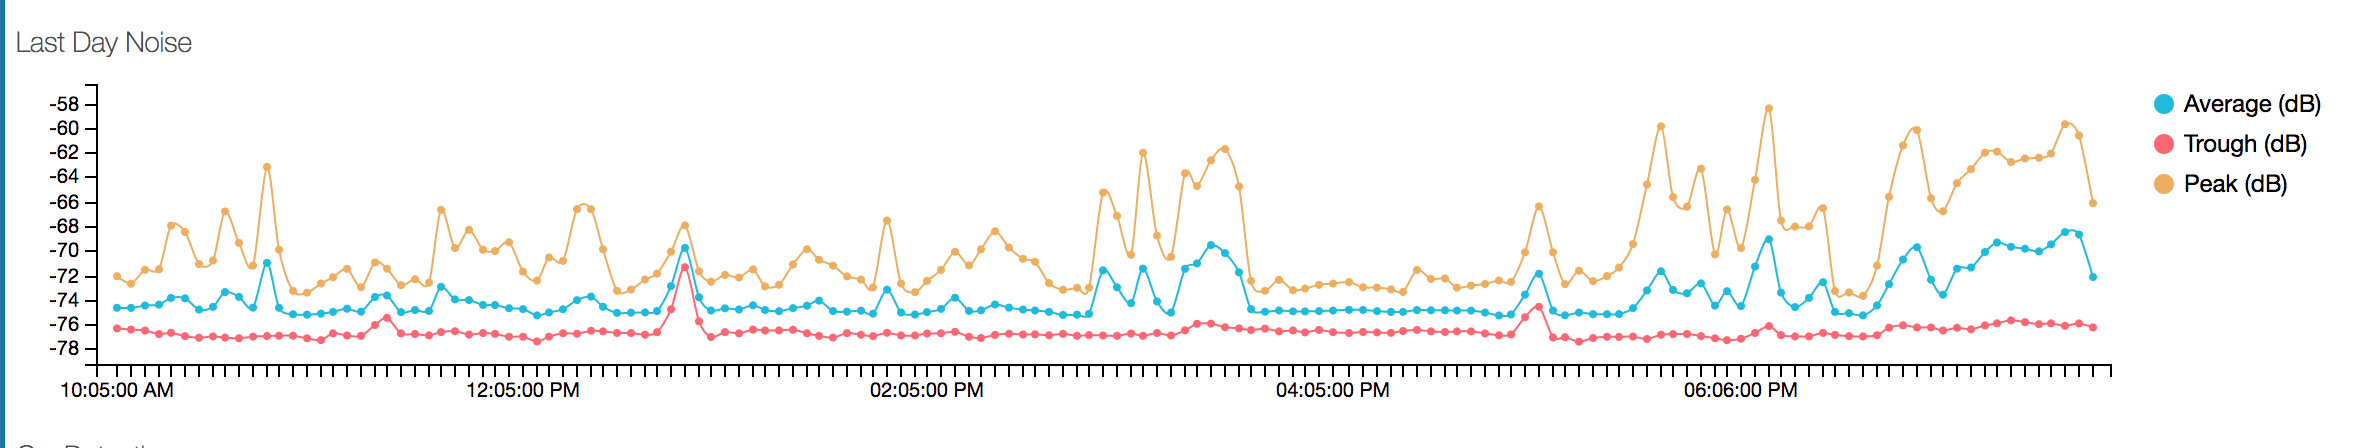
Now, how does one read this graph?
- We can follow the peaks of the audio signal and assume that any noise over a certain dB threshold is the little dude’s screaming.
- We can follow the troughs of the graph and assume that if the trough jumps, then man there is some serious crying going on, since the audio floor of the soundscape has been bumped up!
- Or we can follow the average RMS reading and assume some combination of the two?
The truth of the matter, none of the readings from the Misery Meter (so I called it) were particularly reliable indicators of “the little buddy is crying his little head off”. Sometimes, his crying was at the same volume level as other ambient noises in the house (say, when he’s playing in the other room and someone shuts a door). So it turns out that using volume as a proxy for crying is insufficient to give us reliable results.
Act 2: Enter TensorFlow… next!
In my next post, I’ll discuss how I modified this script to use TensorFlow to train a model that could then be used to enhance the accuracy of little dude’s crying. Stick around, it’ll be fun!